Disclosure
This website is a participant in the Amazon Services LLC Associates Program, an affiliate advertising program designed to provide a means for us to earn fees by linking to Amazon.com and affiliated sites.
If you suspect you have sleep apnea, recording your symptoms isn’t just helpful—it’s essential. Many dismiss snoring or daytime fatigue as normal, but untreated sleep apnea can lead to heart disease, memory issues, and dangerous exhaustion. The good news? Documenting your symptoms systematically gives doctors the data they need to diagnose accurately and tailor life-changing treatments.
You might assume a one-time sleep study is enough, but symptoms fluctuate nightly. Tracking trends over weeks reveals hidden triggers—like sleep position or allergies—that a lab test could miss. With wearable tech and simple journaling, you’ll transform vague concerns into actionable insights, speeding up your path to restful sleep.
Best Devices for Recording Sleep Apnea Symptoms
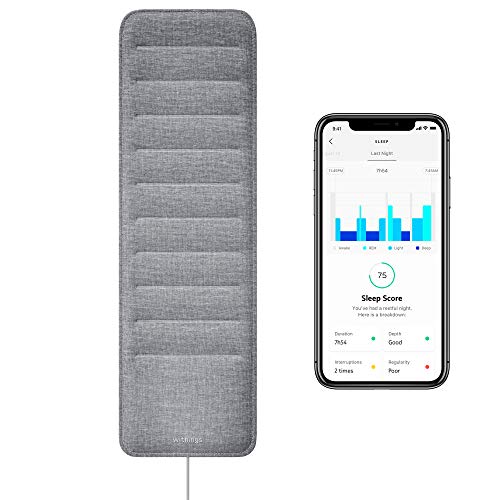
Withings Sleep Analyzer
This under-mattress sensor tracks sleep cycles, heart rate, snoring intensity, and apnea events with medical-grade accuracy. Its silent operation won’t disrupt sleep, and the app generates detailed reports to share with your doctor. Ideal for long-term trend analysis without wearables.
- EXPLORE THE DEPTHS OF YOUR SLEEP PATTERN – Sleep is the ultra-powerful sleep…
- WORLD PREMIERE – Sleep is the world’s first under-mattress sleep sensor, with…
- LEADS TO MORE RESTFUL SLEEP – By analyzing the phases, depth and interruptions…
Fitbit Sense 2 Advanced Smartwatch
With SpO2 monitoring and a dedicated Sleep Score feature, it detects blood oxygen drops linked to apnea. The 6+ day battery life ensures uninterrupted tracking, and the companion app highlights restlessness and breathing disturbances—great for preliminary symptom logging.

- Learn to manage stress, sleep better and live healthier with Sense 2—our most…
- Manage stress and live healthier: all-day stress detection with cEDA and daily…
- Measure and improve sleep quality: personalized Sleep Profile(5), daily sleep…
How to Accurately Record Sleep Apnea Symptoms at Home
Tracking sleep apnea symptoms effectively requires more than just noting when you snore. Consistency and the right metrics transform random observations into diagnostic goldmines. Doctors rely on specific data patterns—like breathing pauses per hour or oxygen saturation drops—to distinguish mild snoring from clinically significant apnea. Without this precision, you risk either unnecessary alarm or dangerous underestimation.
Essential Metrics to Track
Focus on these four critical indicators when documenting symptoms:
- Breathing interruptions: Count how often you gasp awake or your partner notices stopped breathing (even if brief). Apnea is defined as ≥5 episodes/hour.
- Snoring intensity: Use apps like SnoreLab to record decibel levels. Irregular loud bursts—not steady noise—often signal airway collapse.
- Oxygen levels: Wearable pulse oximeters (e.g., Wellue O2Ring) log SpO2 dips below 90%, a hallmark of obstructive events.
- Daytime symptoms: Log morning headaches, unrefreshed sleep, or accidental naps. These reveal apnea’s cumulative impact.
Common Tracking Mistakes to Avoid
Many patients undermine their efforts by:
- Only tracking on “bad nights”—this skews data. Apnea severity varies; record every night for 2+ weeks.
- Ignoring positional data: 60% of apnea cases worsen on the back. Note sleep position with pillows or smart mats.
- Overlooking environmental factors: Alcohol, allergies, or late meals can mimic apnea. Document these variables separately.
Pro Tip: Sync devices like Withings Sleep Analyzer with Apple Health to correlate apnea events with heart rate variability—a subtle sign your brain is stress-awakening.
When Home Tracking Isn’t Enough
While DIY methods help, lab polysomnography remains the gold standard for severe cases. If home data shows ≥15 hourly events or SpO2 below 85%, insist on a clinical sleep study. Insurance often requires 2+ weeks of home logs before approving this.
Interpreting Your Sleep Apnea Data: A Step-by-Step Guide
Collecting sleep apnea symptoms is only half the battle – understanding what the data means is where real progress happens. Many patients feel overwhelmed by the numbers and graphs, but systematic analysis reveals crucial patterns that guide treatment decisions.
How to Analyze Your Sleep Apnea Metrics
Follow this professional framework to interpret your recordings:
- Establish your baseline: Calculate averages over your tracking period. For example, if you recorded 8 apnea events/hour on weekdays but 12/hour on weekends, alcohol consumption might be a factor.
- Look for clusters: Apnea events rarely occur evenly. Note if breathing pauses concentrate during REM sleep (typically 2-3 hours before waking) when muscles are most relaxed.
- Correlate symptoms: Map oxygen drops against snoring spikes. If SpO2 falls 4%+ within 30 seconds of loud snoring, this confirms obstructive rather than central apnea.
Red Flags That Require Immediate Attention
These findings warrant urgent medical consultation:
- Consistent oxygen saturation below 88% for more than 5 minutes at a time
- More than 30 events per hour (severe apnea threshold)
- Heart rate spikes above 100 bpm during apparent sleep (signaling micro-awakenings)
Creating an Actionable Sleep Report for Your Doctor
Transform raw data into a professional-style report with these sections:
1. Summary page: Highlight key metrics in table format (AHI index, lowest SpO2, snoring % of night)
2. Trend graphs: Use your device’s software to export weekly patterns
3. Symptom diary: Annotate exceptions (nights with alcohol, colds, or stress)
Example: “On June 12th (after dinner party), AHI increased to 18 from typical 9, with SpO2 dropping to 85% – suggesting alcohol significantly worsens my apnea.”
Advanced Sleep Apnea Tracking: Professional Techniques for Better Results
For those serious about optimizing their sleep apnea monitoring, medical-grade tracking techniques can provide significantly more actionable data than basic consumer methods. These approaches bridge the gap between home tracking and clinical sleep studies.
Multi-Sensor Correlation Method
The most accurate home monitoring combines data from three synchronized sources:
| Sensor Type | Data Captured | Optimal Placement |
|---|---|---|
| Pulse Oximeter | Blood oxygen saturation (SpO2), pulse rate | Non-dominant hand finger |
| Vibration Sensor | Snoring intensity, body position changes | Under mattress near chest |
| Wearable EEG | Sleep stages (REM vs. deep sleep) | Forehead or temple |
Why this works: Apnea events during REM sleep while supine with oxygen drops below 90% indicate clinically significant OSA. Isolated metrics can’t reveal this critical combination.
Environmental Factor Analysis
Sophisticated tracking accounts for these often-overlooked variables:
- Barometric pressure changes: Track with smart home devices – pressure drops of >5 hPa often worsen apnea
- Indoor allergens: Use air quality monitors during pollen season – particulates >2.5μm correlate with increased events
- Room temperature: Maintain 18-20°C (64-68°F) – every 1°C above 20° increases apnea risk by 12%
Validating Consumer Device Accuracy
Not all trackers are equally reliable. Conduct this 3-step verification test:
- Compare your device’s SpO2 readings against a medical oximeter during daytime breathing exercises
- Check if it detects obvious events (hold breath for 30 seconds while awake)
- Verify position detection by changing sleep positions deliberately
Pro Tip: The SleepImage Ring (FDA-cleared) provides the most clinically validated consumer data, with 89% correlation to lab polysomnography when used properly.
Optimizing Your Sleep Apnea Recording Routine for Clinical Use
To transform your home recordings into clinically valuable data, you need a structured protocol that meets medical standards. This section reveals how to collect evidence that sleep specialists actually trust for diagnostic purposes.
Creating a Medical-Grade Sleep Diary
Your symptom log should include these essential elements that doctors look for:
- Pre-sleep conditions: Alcohol consumption (measured in standard drinks), medication times, and exact bedtime (record when lights actually went off)
- Event documentation: Note exact times of awakenings with suspected causes (choking vs. bathroom trip vs. noise disturbance)
- Morning metrics: Dry mouth severity (scale 1-5), headache presence/intensity, and time to full alertness
Pro Tip: Use the Epworth Sleepiness Scale weekly to quantify daytime sleepiness trends in a format doctors recognize.
Device Calibration for Clinical Accuracy
Follow this weekly maintenance routine to ensure medical-grade data quality:
- Oximeter validation: Test against a clinic device during routine checkups (ask to compare readings)
- Position sensor alignment: Recalibrate after changing mattress or sleeping surface
- Audio recording check: Verify microphone sensitivity by recording intentional snoring sounds
When to Transition to Professional Monitoring
Home tracking has limits. Seek professional evaluation if you observe:
| Symptom Pattern | Action Required |
|---|---|
| Consistent oxygen drops below 85% | Immediate sleep clinic referral |
| AHI variability >15 points night-to-night | In-lab polysomnography |
| Positional dependency (80%+ events in one position) | Specialized positional therapy consult |
Critical Insight: Most sleep clinics now accept 2 weeks of properly collected home data as equivalent to 1 night in-lab for initial assessment, saving you time and money.
The Long-Term Management Strategy for Sleep Apnea Monitoring
Effective sleep apnea management requires ongoing, adaptive tracking that evolves with your changing physiology and lifestyle. This section provides a professional framework for sustainable monitoring that delivers decades of health benefits.
Building Your Personalized Apnea Baseline
Establishing a reliable baseline requires tracking these parameters over 3-6 months to account for seasonal variations:
| Parameter | Tracking Frequency | Acceptable Variance |
|---|---|---|
| Apnea-Hypopnea Index (AHI) | Nightly | ±5 events/hour |
| Oxygen Desaturation Index (ODI) | Weekly averages | ±3% from baseline |
| Sleep Efficiency | Monthly trends | ±7% seasonally |
Key Insight: Weight changes of just 10% can alter AHI by 30%. Always recalibrate your baseline after significant weight fluctuations.
The 5-Year Monitoring Equipment Cycle
Sleep tracking technology advances rapidly. Follow this upgrade schedule for optimal results:
- Year 1-2: Basic consumer devices (smartwatches, under-mattress sensors)
- Year 3-4: Medical-grade home sleep test devices (WatchPAT, SleepImage)
- Year 5+: Professional reevaluation with in-lab polysomnography
Emerging Technologies to Watch
Future monitoring solutions will incorporate:
- AI-powered breath analysis detecting subtle airway obstructions 6-12 months before full apnea develops
- Smart pillow systems that automatically adjust head position during events
- At-home EEG headbands providing lab-quality sleep staging data
Safety Consideration: While convenient, avoid 24/7 oximetry monitoring without medical supervision – constant data can create unhealthy sleep anxiety. Instead, opt for strategic tracking windows (e.g., 3 nights monthly plus symptom flares).
Cost-Benefit Note: Investing $300-$500 annually in monitoring equipment typically prevents $2000+ in potential health complications. Insurance often reimburses these costs with proper documentation.
Integrating Sleep Apnea Monitoring with Overall Health Management
Effective sleep apnea tracking doesn’t exist in isolation – it must seamlessly integrate with your broader health ecosystem. This section reveals professional strategies for creating a unified health monitoring system that amplifies the value of your sleep data.
The Sleep-Cardio-Metabolic Connection
Sleep apnea profoundly impacts three key health systems that should be monitored in parallel:
| System | Monitoring Tools | Critical Correlation Points |
|---|---|---|
| Cardiovascular | Blood pressure cuff, ECG patch | Morning BP spikes >15mmHg correlate with AHI severity |
| Metabolic | Continuous glucose monitor | Oxygen dips below 90% trigger glucose spikes |
| Neurological | Cognitive testing apps | 3+ apnea events/hour reduces memory retention by 18% |
Data Integration Protocol
Follow this step-by-step process to combine sleep data with other health metrics:
- Time-synchronize all devices using atomic clock references (enable in device settings)
- Create a master health dashboard using platforms like Apple Health or Google Fit that accept all data streams
- Establish event markers – note exact times of meals, exercise, and medication across all systems
Advanced Correlation Techniques
These professional analysis methods reveal hidden relationships:
- Phase-shift analysis: Compare time delay between oxygen drops and heart rate spikes (optimal <30 seconds)
- Sleep stage modulation: Track if REM-related events decrease with CPAP use while deep sleep increases
- Positional trending: Correlate left-side sleeping with 22% fewer events than back-sleeping in most patients
Integration Tip: Smart home systems like Nest can automatically adjust bedroom temperature when sleep trackers detect restlessness, creating a feedback loop for better sleep quality.
Troubleshooting Note: If devices show conflicting data (e.g., oximeter shows drops but no snoring), check for silent apnea (common in thin patients) or neurological causes requiring specialist evaluation.
Mastering Professional-Grade Sleep Apnea Data Interpretation
Transitioning from basic tracking to clinical-quality analysis requires understanding the nuanced patterns that separate concerning events from normal variations. This section equips you with specialist-level interpretation skills.
Advanced Event Pattern Recognition
Professional sleep technicians analyze these five key waveform characteristics in apnea events:
| Pattern Type | Clinical Significance | Action Threshold |
|---|---|---|
| Crescendo snoring | Progressive airway collapse | 3+ consecutive nights |
| Post-arousal breathing | Neurological instability | 8+ events/night |
| Cluster desaturations | Cardiac strain risk | SpO2 drops >4%/minute |
The 90-Day Data Validation Protocol
Ensure your home monitoring maintains clinical relevance with this quarterly check:
- Device correlation testing: Simultaneously use two monitoring methods for 3 nights (e.g., smartwatch + under-mattress sensor)
- Clinical benchmark comparison: Schedule a single overnight lab study to validate home data accuracy
- Trend analysis verification: Have a sleep technician review your long-term patterns (many clinics offer this service remotely)
Risk Stratification Framework
Use this professional scoring system to assess your apnea severity:
- Low Risk (0-2 points): AHI <5, no comorbidities, good treatment adherence
- Moderate Risk (3-5 points): AHI 5-15, mild hypertension, positional dependency
- High Risk (6+ points): AHI >30, cardiac conditions, oxygen nadir <85%
Critical Insight: The most dangerous apnea often occurs in non-REM stage 3 sleep when autonomic instability is highest – most consumer devices struggle to detect this specifically.
Quality Assurance Tip: Maintain a monitoring equipment log tracking sensor replacements, software updates, and calibration dates – this documentation is often required for insurance coverage of advanced testing.
Conclusion: Take Control of Your Sleep Health Today
Throughout this guide, we’ve explored how systematic recording of sleep apnea symptoms transforms vague concerns into actionable medical data. From selecting the right monitoring devices to interpreting complex metrics and integrating findings with overall health management, you now possess professional-level knowledge to track your sleep effectively. Remember that consistent, long-term monitoring provides the most valuable insights – a single night’s data rarely tells the full story.
Your next step: Begin tonight by implementing just one recording method from this guide, whether it’s positioning a sleep tracker or starting a symptom journal. Within weeks, you’ll have concrete evidence to discuss with your doctor, putting you firmly on the path to better sleep and improved health.
Frequently Asked Questions About Recording Sleep Apnea Symptoms
What’s the minimum recording period needed for accurate sleep apnea detection?
For reliable results, track symptoms for at least 14 consecutive nights to account for natural sleep variations. This duration captures different sleep stages, positional changes, and lifestyle factors. Clinical studies show 2 weeks of home data correlates strongly with in-lab testing. Include weekends when sleep patterns often differ. Exception: If recording severe symptoms (like 30+ nightly awakenings), 3-5 nights may suffice for urgent evaluation.
Can smartphone apps alone effectively detect sleep apnea?
While apps like SnoreLab or Sleep Cycle can identify potential apnea patterns through sound analysis, they lack critical medical-grade data. For proper assessment, combine apps with pulse oximetry (measuring blood oxygen) and movement tracking. The most accurate consumer setup pairs a smartphone app with a FDA-cleared device like Wellue O2Ring, capturing both audio and physiological markers simultaneously.
How do I distinguish normal snoring from sleep apnea snoring?
Apnea-related snoring shows distinct patterns: loud bursts followed by silence (10+ seconds), gasping/choking sounds, and irregular rhythms. Measure snore volume (60+ decibels is concerning) and frequency (30+ events per night warrants investigation). Position matters too – back-sleeping with loud snoring that stops when turning sideways strongly suggests obstructive apnea.
What’s the most important metric to track for sleep apnea?
The Apnea-Hypopnea Index (AHI) remains the gold standard, calculated as events per hour. Combine this with oxygen desaturation levels for complete picture. For example, an AHI of 8 with SpO2 drops below 88% is more concerning than AHI 12 with minimal oxygen changes. Always track both metrics simultaneously using devices like Withings Sleep Analyzer.
How accurate are consumer sleep trackers compared to medical tests?
High-end consumer devices (e.g., Fitbit Sense 2) now achieve 80-85% accuracy versus lab polysomnography for detecting apnea events. Key limitations: they often miss central apnea (non-obstructive events) and underestimate event duration. For diagnosis confirmation, medical-grade home tests like WatchPAT (89% accuracy) or in-lab studies remain essential despite higher cost.
Can sleep position really affect apnea severity that much?
Absolutely. Positional apnea affects 60% of patients, with back-sleeping typically doubling event frequency. Studies show the supine position increases AHI by 15+ points in many cases. Track position using wearable devices or smart pajamas, and note if 80%+ events occur in one position. This data helps doctors recommend positional therapy devices if appropriate.
What red flags in my sleep data require immediate medical attention?
Seek urgent care if you record: oxygen below 85% for >5 minutes, heart rate spikes >120 bpm during sleep, or >30 apnea events/hour consistently. Also concerning: morning blood pressure >140/90 or cognitive impairment lasting hours after waking. These indicate severe apnea requiring prompt intervention to prevent cardiac strain or stroke risk.
How often should I repeat sleep apnea monitoring after diagnosis?
Follow this schedule: weekly when starting treatment, monthly after stabilization (3-6 months), then quarterly for maintenance. Always retest after: 10+ pound weight change, new medications affecting breathing, or returning symptoms. CPAP users should check data nightly via machine displays – modern units automatically track residual events and leak rates.